添加自定义x,y刻度
添加自定义x,y刻度
import matplotlib.pyplot as plt
import random
# 0. 准备数据
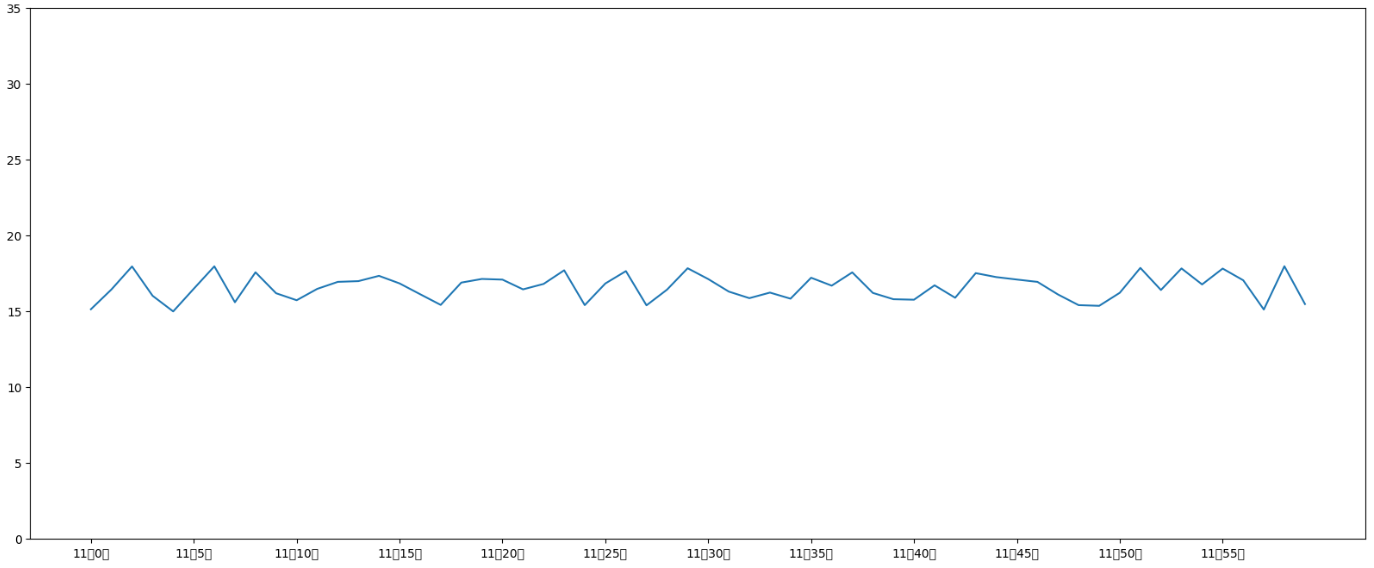
x = range(60)
y_shanghai = [random.uniform(15, 18) for i in x]
# 1. 创建画布
plt.figure(figsize=(20, 8), dpi=100)
# 2. 绘制图像
plt.plot(x, y_shanghai)
# 2.1 添加x,y轴刻度
# 设置x,y轴刻度
x_ticks_label = ['11点{}分'.format(i) for i in x]
y_ticks_label = range(40)
# 修改x,y轴坐标刻度显示
# plt.xticks5] # 坐标刻度不可以直接通过字符串修改
plt.xticks5], x_ticks_label[::5]
plt.yticks5]
# 3. 图像显示
plt.show()